

Has LA Lost Its Luster?
Has LA Lost Its Luster?

Quote of the Week
“After an impressive start to the year, in which the state added jobs at a rate 20% higher than the rest of the nation, we shouldn’t overinterpret a slowdown in one month. Still, California’s tight labor market has not eased up and will continue to act as a constraint on job growth.”
Taner Osman, Research Manager at the UCR Center for Economic Forecasting and Beacon Economics
CA Ballot Initiative to Oppose
This November Proposition 30, which would tax Californians to fund a “Clean Air Initiative” featuring a rebate program for zero-emission vehicles.
The State Building and Construction Trades Council of California, endorsed the measure saying it “will provide good-paying green jobs to help build the charging station infrastructure we need across the state to reduce emissions and fight climate change.”
Governor Newsom, the CA Chamber, and CA Teachers Association are against the measure. For good reason. The measure is funded largely by Lyft, which is facing a state law that requires Lyft and Uber drivers to log 90% of CA miles in electric vehicles by 2030.
Their solution - tax people earning more than $2 million (~35K taxpayers) to fund a collection of climate programs, including incentives for people to buy zero-emission vehicles.
Governor Newsom remarked that Californians should know that just this year CA committed $10 billion for electric vehicles and their infrastructure and this measure just funnels money to a singular private sector company that has their own capital to invest.
Big Picture
Last week I highlighted the declining student enrollment at LAUSD. This week another article was published on the topic and something stood out - LAUSD's Superintendent said a lot of the decline came from families leaving the state and that the largest drop have been among middle-class families.
Unfortunately for LA's economy and economic outlook this is part of a larger trend I have highlighted throughout the past few years - workers no longer seeing LA as a land of opportunity for economic and residential mobility and quality of life standards that match what one pays in taxes and fees. And COVID just added that little extra push people needed to pick up and relocate.
This past week William H. Frey, a Senior Fellow at Brookings Metro, released his analysis on which big US cities saw historic population losses and a decline in suburban growth during the core part of the pandemic.
The chart below shows the US cities with the greatest percentage losses - San Francisco, New York, Washington, D.C., and Boston. Overall, there was a dramatic rise in the number of cities that lost population.
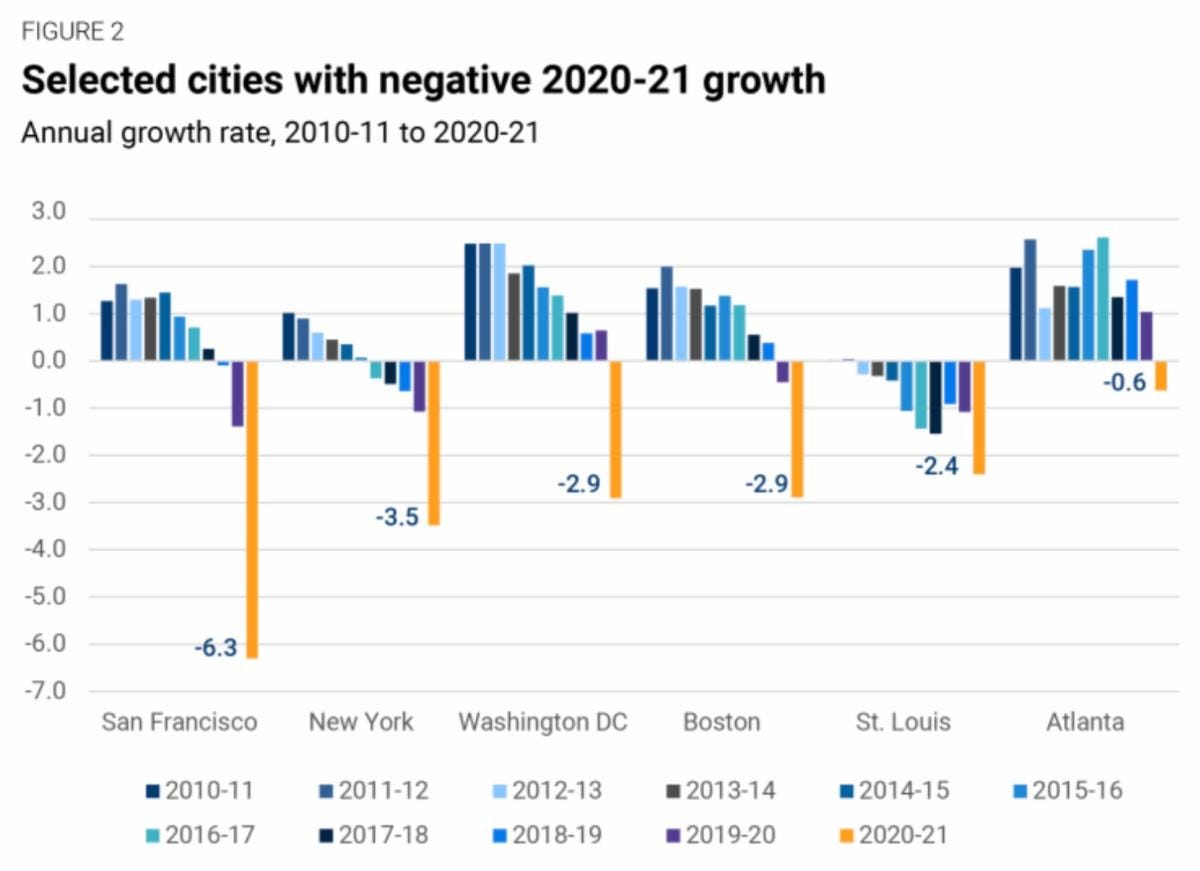
For some reason the City of LA did not make the chart, so I pulled the data, which is below:
2020 Population: 3,889,834
Annual Growth Rates:
2010-2011: 0.62
2011-2012: 0.76
2012-2013: 0.78
2013-2014: 0.68
2014-2015: 0.76
2015-2016: 0.61
2016-2017: 0.44
2017-2018: 0.15
2018-2019: 0.04
2019-2020: (0.32)
2020-2021: (1.04)
The growth difference from 2020-21 to 2019-2020: (0.72)
To put things in context, America’s big cities have always experienced noticeable ups and downs.
The City of LA's growth and decline:
2000-2001: +32,266
2005-2006: -20,237
2015-2016: +23,876
2020-2021: -40,537
To help put some of this in context - LA is one of the top three US cities that flipped from being among the greatest population-gaining cities in 2010-11 to those with population losses in 2020-21.
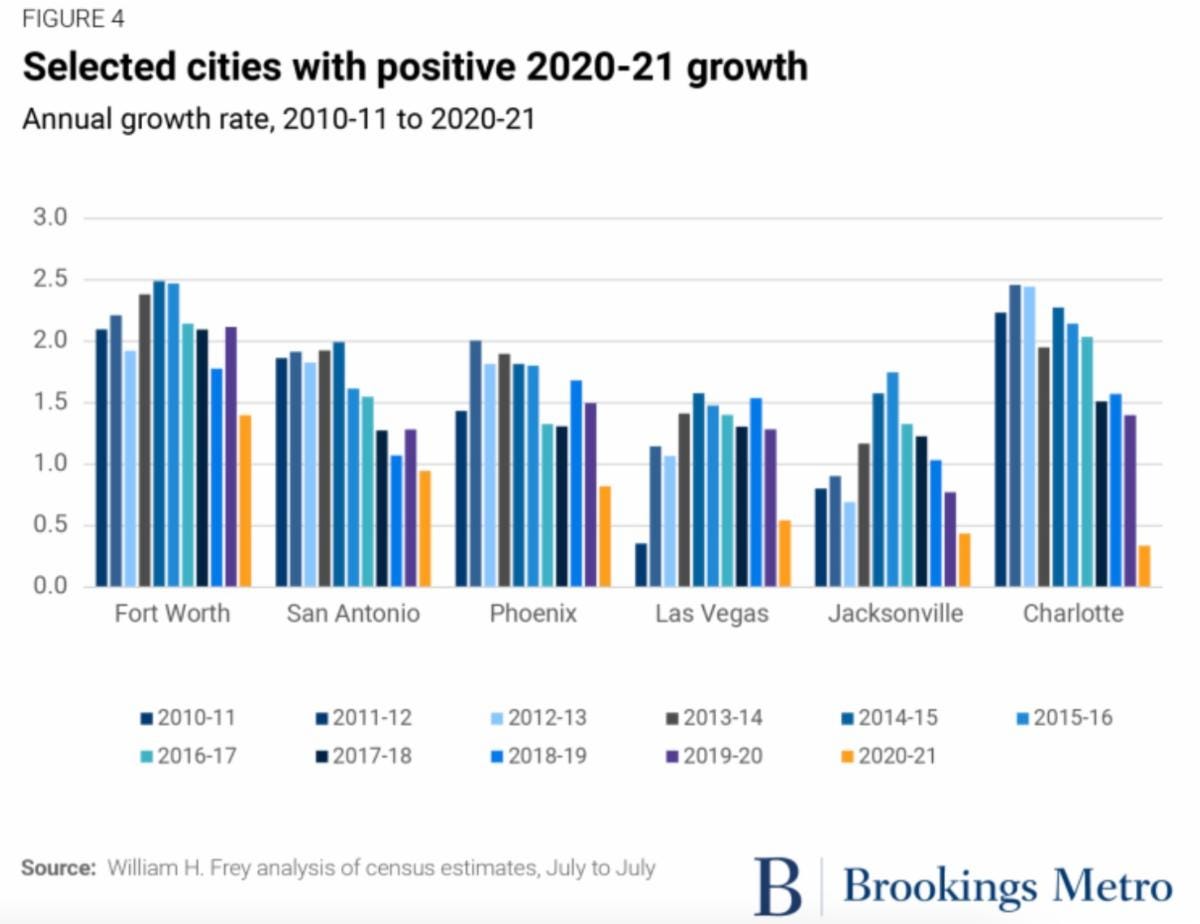
The gainers have been Phoenix, San Antonio, and Fort Worth - See Chart Below - and four in interior cities within California (Riverside, Stockton, Fresno, and Bakersfield), two in Nevada (Reno and North Las Vegas), as well as Gilbert, Arizona and Raleigh, N.C.
Further data shows changes to the suburbs of major metropolitan areas, which—while benefitting somewhat from recent city population losses— are showing growth slowdowns of their own.
Recent number show that the largest recent net domestic migration loss occurred in the New York metropolitan area at 385,000. The city of New York accounted for 342,000 of this loss, with a much smaller net out migration of 43,000 from the suburbs.
Metro Los Angeles had the second largest net migration loss at 205,000, with a 180,000 loss in core Los Angeles County.
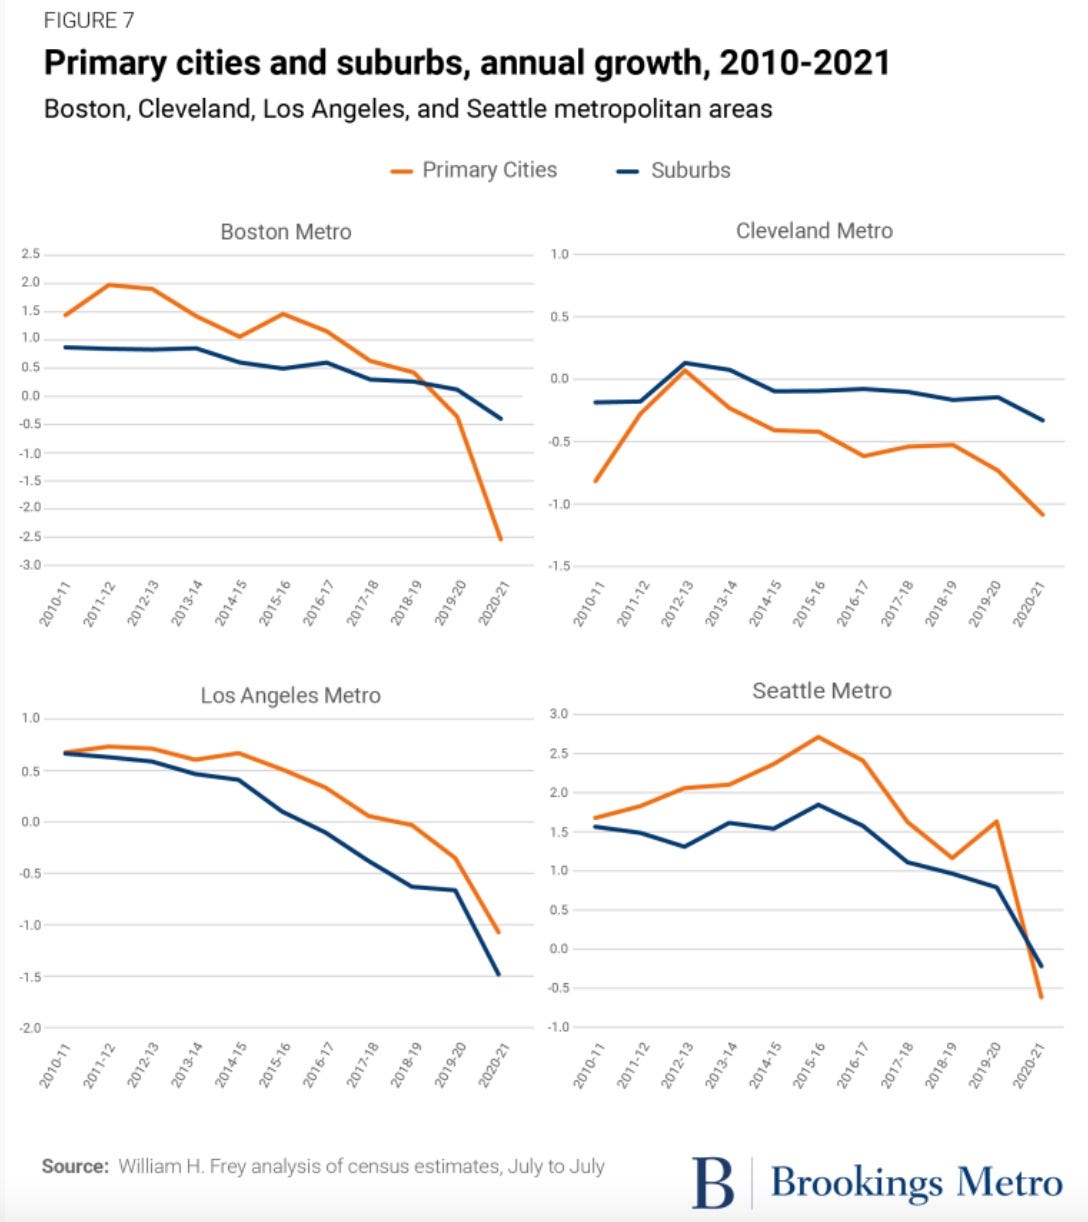
To put the city/metro area changes in context, the chart below shows, in the LA metro area, the primary city grew more rapidly (or declined less) than its suburbs throughout the decade. Notice just how much of a huge dip occurred in 2020-21.
Overall the data shows: The LA Metropolitan region - Los Angeles - Long Beach Anaheim - experienced it largest growth in recent years back in 2010-2014 - averaging around .6%. While the primary city growth was slightly higher, averaging around .7% during the same time period. Than the primary city rate in 2019 went to -.4 and 2021 -1.1, while the metro region went to 2000 -.7 to -1.5 in 2020-2021.
A new book - Survival of the City - by Edward Glaeser and David Culter offers a blueprint for addressing the vast disparities in health and economic mobility that the events of the past year have thrust into the spotlight.
At the top of the list is the future of remote working, housing and social issues such as education and crime, all things that must be addressed to help get Angelenos back on the road to urban renewal and overall economic well-being.
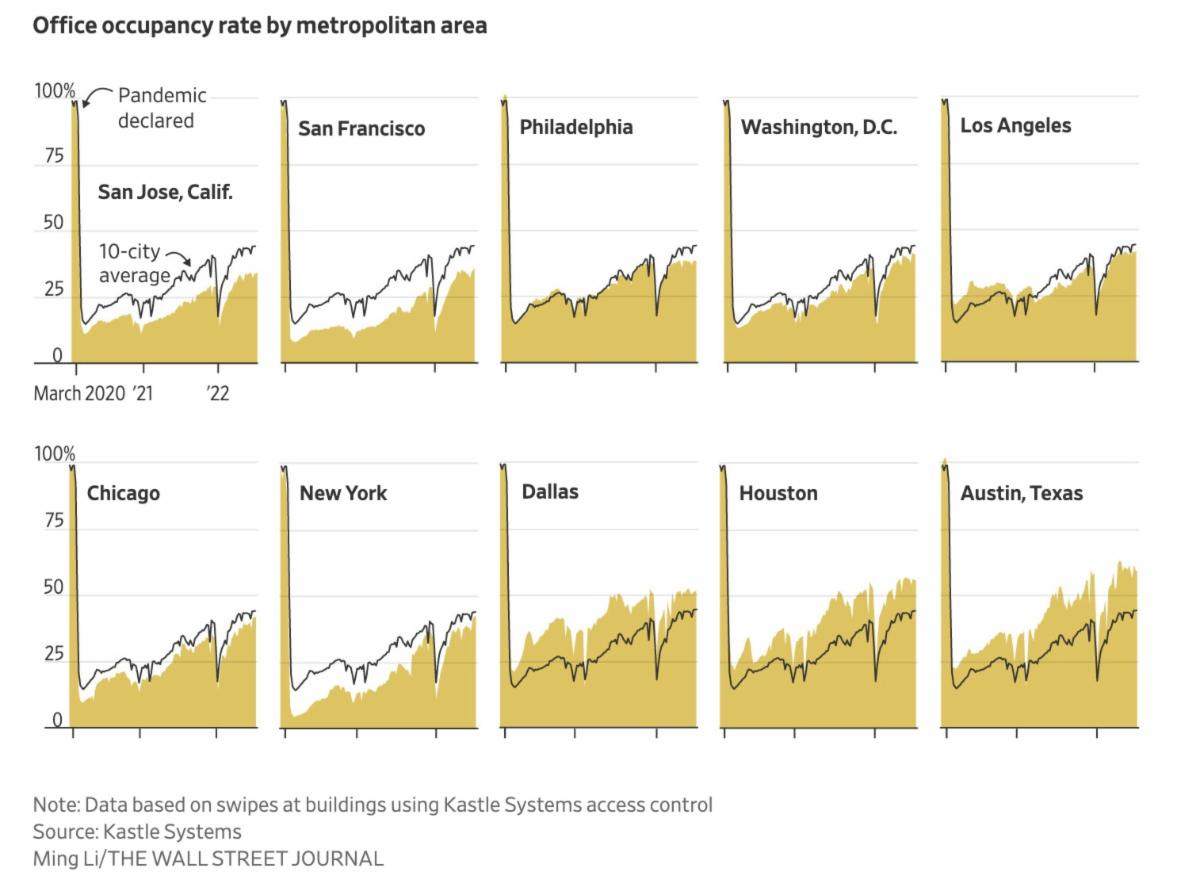
Data seems to show some good news for LA. According to the WSJ, nationally, office use hit a pandemic-era high of 44% in early June, while cities like Philadelphia, Chicago, San Francisco, and New York have lagged behind, LA looks to be hovering around the 10-city average. People back in the office, even for a few days a week generate local economic activity and jobs!
The reality is many of those who fled LA may not return, LA gains will be the hands of younger generations and new immigrant waves—groups that in the past tended to choose big cities as their destinations. We must give them an incentive to choose LA as their home.
Tocqueville once said that people "can achieve almost nothing by themselves," remains true to this day, therefore it continues to be imperative that everyone who has a stake in the future of LA continue to build up our communities where everyone has a chance to contribute to and share in the equitable growth we need to move forward.
CA's Drought
Here’s a look at the status of CA’s reservoirs during another drought: There has not been much good news about CA’s water supply lately, but there could be some relief on the way.
The North-of-Delta Offstream Storage project, often referred to as the planned Sites Reservoir, was authorized by Congress in 2003. The long delayed project got a financial boost in March when the federal government signaled its intent to loan the project nearly $2.2 billion — about half of the cost to design, plan and build it.

Recession?
Real GDP in the first quarter contracted at an annualized rate of 1.6% for the US and 1.0% for California.
The Atlanta Federal Reserve Bank GDPNow current indicator tracking suggest another 1.6% contraction in the 2nd quarter as well.
CA Budget: The most recent cash flow report from CA's Department of Finance indicates revenues fell short of projections rather than greatly exceeding them. Fiscal year-to-date revenues in June came in $2.2 billion below the 2022 Budget Act projections. Personal Income Tax receipts alone came in $4.5 billion lower.
What to watch:
Budgetary reserves are in a good place, but a number of debts are unresolved and growing. CA's unemployment insurance fund is wholly unprepared for another round of renewed demand.
CA carries the largest debt owed to the federal trust fund, while every other state except New York and Massachusetts has substantially reduced or paid off their debt including—as specifically authorized—use of federal pandemic assistance funds for this purpose.
While the state added jobs at a healthy pace in 2021 and 2022, as of June 2022, California has recovered just 93.6% of the jobs that were lost in March and April 2020, the onset of the pandemic. There are still 193,800 fewer people employed in CA compared to pre-pandemic February 2020.
Unemployment Rate:
Reported unemployment rate in June improved 0.1 point to 4.2%. CA had the 11th highest unemployment rate among the states and DC.
The June numbers show the number of unemployed essentially unchanged with a dip of 9,900. Employment rose 75,000. The labor force was up by 65,200.
LA County’s unemployment rate rose slightly to 5.3% in June, up from a revised 5.2% in May (CA EDD) The 5.3% rate was well below the 9.7% rate in June 2021. Total nonfarm employment in LA County increased by 9,500 jobs between May and June to reach more than 4.5 million. The leisure and hospitality sector led the way by adding 5,200 jobs. (CA EDD)
In Orange County, where seasonally adjusted figures were not available, the June unemployment rate was 2.9%, up from 2.4% in May.
Chart: The unemployment insurance claims data also reflects a continuing lag in getting people back to work. Since April, weekly initial claims have trended about 7% above the pre-pandemic average in 2019, while the US total has trended 5% below. For the past 4 weeks ending with the week of July 16, CA initial claims were 19% of the national total, while insured unemployment (a proxy for continuing claims) in the 4 weeks through the week of July 9 was 22% of the total.
Something to Watch - US Economy: For the period from June 29 to July 11, 3.9 million Americans said they didn’t work because they were sick with Covid-19 or were caring for someone with it, according to Census Bureau data. In the comparable period last year, 1.8 million people missed work for those reasons.
What’s New with Measure W
In 2018, L.A. County voters approved Measure W, a parcel tax to provide local, dedicated funding for multi-benefit stormwater projects via the Safe, Clean Water Program (SCWP).
SCWP: The Safe Clean Water Program is modernizing our 100-year-old water system, to better protect public health and the environment, and maximize a cleaner, locally controlled water supply.
Project development: ARLA's web section is focused on the ongoing work to optimise the processes of project development for Measure W, to ensure projects solve water issues (drought, pollution, supply, etc), while simultaneously resulting in the greatest equitable economic development and benefits to the most vulnerable and disadvantaged communities.

The link highlights the work of a number of leaders in this space, including Andy Lipkis, who lead 13 months of focused work with engineers, economists and others, while facilitating a collaborative consensus process with NGO and Municipal leaders. This produced guidance for LA County on how to spend the $250 million per year for Measure W. It's having an impact .